First, which scanner?
Look near the report header or footer for the manufacturer and model. If it is missing, ask the clinic. These are simplified teaching labels, not copies of a manufacturer’s report.
Look for a CoreScan VAT mass or volume field. GE and Hologic reference numbers are not interchangeable.
Look for the model and software in the report details. Check whether a VAT field is an area or a mass.
The table selector remembers only your scanner choice on this browser. The age and measurement fields are not saved or transmitted.
Body fat percentage on a DEXA scan
Body fat percentage describes fat mass as a proportion of the mass being measured. Start with the scanner, region and denominator before comparing the number with a reference table.
Body fat percentage references
The source uses a reversed fitness-style ranking: 90th means the lower end of the distribution, 10th the higher end. These labels do not measure fitness or health.
| Age | n | Mean ± SD | 90th | 80th | 70th | 60th | 50th | 40th | 30th | 20th | 10th |
|---|---|---|---|---|---|---|---|---|---|---|---|
| 20-29 | 562 | 31.4± 8.5 | 22.1 | 24.5 | 26.4 | 28.1 | 29.9 | 32.1 | 35.4 | 38.3 | 43.2 |
| 30-39 | 196 | 36.6± 11.0 | 21.4 | 26.8 | 29.3 | 33.4 | 36.8 | 40.6 | 43.6 | 46.8 | 50.7 |
| 40-49 | 258 | 39.2± 9.7 | 24.5 | 31.4 | 34.3 | 37.4 | 40.0 | 42.6 | 44.5 | 48.2 | 51.0 |
| 50-59 | 437 | 41.7± 8.7 | 30.3 | 34.4 | 38.0 | 40.5 | 42.7 | 45.0 | 47.0 | 49.3 | 51.8 |
| 60-69 | 440 | 42.4± 7.7 | 32.5 | 35.5 | 38.6 | 40.8 | 42.4 | 44.9 | 47.0 | 49.1 | 52.2 |
| 70-79 | 183 | 40.4± 7.9 | 30.5 | 35.5 | 37.9 | 39.6 | 41.2 | 43.5 | 45.8 | 48.2 | 50.1 |
Choose an age to highlight a row. No values are sent to the server.
Population reference, not a target. 3,327 US adults, 95% Caucasian; GE Lunar Prodigy or iDXA. These are not Australian norms or athlete targets. Source and table ↗ · Checked 23 September 2026.
Read the percentage alongside kilograms
A percentage and a mass answer different questions. Fat mass tells you the estimated amount of fat in the scanned region. The percentage tells you how large that amount is relative to another quantity. A change in lean tissue can move the percentage even when fat mass stays the same. That is why comparing only the headline percentage can give an incomplete account of two scans.
In our invented GE example, 24.5 kg of fat divided by 68.0 kg total scanned mass is 36.0% after rounding. The same report also contains 41.0 kg lean tissue and 2.5 kg bone mineral content. Those three masses add to 68.0 kg. They are educational values, not suggested targets.
Where the comparison comes from
The GE table comes from Imboden and colleagues, who studied 3,327 US adults aged 20 to 79. Ninety-five per cent of participants were Caucasian. The measurements came from GE Lunar Prodigy and iDXA scanners. The sample was not a representative survey of Australian adults, and its percentiles do not describe an ideal athletic population.
The Hologic table is calculated from Kelly and colleagues’ NHANES reference curves. We show the White adult reference set and identify the exact age used for each displayed decade. The published supplement gives M, standard deviation and L. Standard deviation is divided by M before using the LMS formula. This distinction matters: putting the unconverted standard deviation into the formula gives incorrect values.
The two tables also use different percentile directions. The GE source ranks lower fat values towards the 90th percentile. The Hologic table uses conventional percentiles, where higher values are towards the 95th. Neither direction turns a population comparison into a health score.
What matters when the number changes
Check the fat mass, lean tissue, total scanned mass and preparation notes together. A repeat scan is most useful when it answers a question you and your practitioner agreed on before testing. Ask whether the difference is larger than the clinic’s least significant change and whether any change in scanner or software affects the comparison.
There is no single rescan interval or rate of change that follows from a percentage. Training, nutrition, illness and changes in fluid or glycogen can affect the report in different ways. Your practitioner can help choose an interval long enough to answer the question without encouraging frequent testing of ordinary variation.
Why another device gives another answer
A bathroom scale using bioimpedance and a DEXA scanner do not measure body composition in the same way. Each estimates compartments from a different physical signal and model. A difference between them does not mean your body changed between stepping off the scale and lying on the scan bed. Avoid combining readings from different methods into one trend.
If the report lists both tissue % fat and region % fat, ask which denominator is being used. In the format discussed in the original STRIVE booklet, tissue percentage excludes bone mineral from the denominator. Region percentage includes it. Comparing those columns as if they were identical can create an apparent discrepancy within a single report.
Questions for your practitioner
- Which scanner, software and reference population were used?
- Is this a total-mass or soft-tissue percentage?
- Do the kilogram changes support the same interpretation as the percentage?
Sources checked 23 September 2026: Source 1 · Source 2.
Open the full body fat percentage on a dexa scan guide ↗Fat mass index: what FMI means
Fat mass index adjusts measured fat mass for height. It is calculated as fat mass in kilograms divided by height in metres squared, and is reported in kg/m².
| Source category | Men | Women |
|---|---|---|
| Severe fat deficit | <2 | <3.5 |
| Moderate fat deficit | 2 to <2.3 | 3.5 to <4 |
| Mild fat deficit | 2.3 to <3 | 4 to <5 |
| Normal | 3 to 6 | 5 to 9 |
| Excess fat | >6 to 9 | >9 to 13 |
| Obese class I | >9 to 12 | >13 to 17 |
| Obese class II | >12 to 15 | >17 to 21 |
| Obese class III | >15 | >21 |
Fat mass index references
The source uses a reversed fitness-style ranking: 90th means the lower end of the distribution, 10th the higher end. These labels do not measure fitness or health.
| Age | n | Mean ± SD | 90th | 80th | 70th | 60th | 50th | 40th | 30th | 20th | 10th |
|---|---|---|---|---|---|---|---|---|---|---|---|
| 20-29 | 562 | 7.6± 3.6 | 4.30 | 5.00 | 5.60 | 6.00 | 6.60 | 7.30 | 8.20 | 9.50 | 11.90 |
| 30-39 | 196 | 10.0±5.2 | 4.40 | 5.40 | 6.40 | 7.50 | 8.90 | 10.20 | 11.90 | 14.30 | 18.00 |
| 40-49 | 258 | 11.0±5.1 | 4.90 | 7.00 | 7.80 | 8.60 | 9.70 | 11.30 | 12.80 | 15.40 | 19.20 |
| 50-59 | 437 | 12.0±4.9 | 6.40 | 7.60 | 9.10 | 10.10 | 11.30 | 12.80 | 14.40 | 16.30 | 18.70 |
| 60-69 | 440 | 12.1±4.5 | 6.80 | 8.00 | 9.40 | 10.30 | 11.20 | 12.90 | 14.30 | 15.60 | 18.10 |
| 70-79 | 183 | 10.8±3.8 | 6.40 | 8.00 | 8.80 | 9.60 | 10.50 | 11.60 | 12.80 | 14.40 | 16.30 |
Choose an age to highlight a row. No values are sent to the server.
Population reference, not a target. 3,327 US adults, 95% Caucasian; GE Lunar Prodigy or iDXA. These are not Australian norms or athlete targets. Source and table ↗ · Checked 23 September 2026.
Calculate it from the report
Take the total fat mass, not total body weight. Convert height to metres, multiply that height by itself, then divide fat mass by the result. For the invented example, 24.5 ÷ (1.68 × 1.68) gives approximately 8.68 kg/m². Dividing 68 kg body weight by height squared would calculate BMI instead.
Height errors matter because the denominator is squared. If you cannot find height on the report, ask the clinic which value it entered. A report without FMI can still contain enough information to calculate it, provided the fat mass covers the whole body rather than just the trunk or a limb.
Read the classification in context
Kelly and colleagues proposed FMI categories by matching their prevalence to established BMI categories at age 25 in the US reference population. The category names in the table are the authors’ terminology. They are not a personal diagnosis, a treatment plan or an Australian screening recommendation.
FMI separates fat mass from lean tissue in its numerator, unlike BMI. That makes it useful for describing body composition, but it does not measure where fat is stored, physical fitness, nutrition adequacy or metabolic health. Two people with the same FMI can have different reasons for testing and different needs.
The classification and a percentile table are also different tools. A category uses a specified boundary; a percentile locates a value in a selected distribution. Do not treat a shift across a rounded category boundary as proof of an important biological change.
What to compare over time
If adult height is unchanged, FMI mainly follows measured fat mass. Check that repeat scans use the same whole-body definition and comparable preparation. A change in the reported height can alter FMI without any change in fat mass. Keep the original report values so the calculation can be checked.
When looking at a GE report, the scanner-specific Imboden FMI percentiles provide a separate population comparison. The Kelly classification originated from Hologic NHANES data and should not be treated as an interchangeable manufacturer-specific diagnostic scale. Ask which interpretation your clinic uses and why.
Avoid turning a category into a goal
The purpose of the table is to explain a term you may see on a report. It cannot determine a suitable body composition for an athlete, someone recovering from illness or a person with a history of restrictive eating. A practitioner considers symptoms, training demands, medical history and the reason for testing alongside the scan.
There is no recommended timetable for moving between FMI categories. If you are changing nutrition or training, agree on what outcome matters and how it will be assessed. Energy, recovery and performance may be more useful immediate observations than a small movement in one index.
Questions for your practitioner
- Was FMI calculated from total fat mass and the correct height?
- Is this a percentile or a proposed classification?
- What would a change in FMI add to the decisions we are making?
Sources checked 23 September 2026: Source 1 · Source 2.
Open the full fat mass index: what fmi means guide ↗Lean mass and ALMI on your report
Lean soft tissue includes water, organs and muscle. ALMI focuses on lean tissue in the arms and legs relative to height; it is one measurement, not a test of strength.
| Measure | Men | Women |
|---|---|---|
| Appendicular mass (ASM) | <20 kg | <15 kg |
| ASM / height² | <7.0 kg/m² | <5.5 kg/m² |
| Grip strength (not measured by DEXA) | <27 kg | <16 kg |
Keep the compartments separate
Total lean tissue is not the same thing as total muscle. DEXA separates estimated fat, lean soft tissue and bone mineral compartments. A result labelled lean plus BMC combines two of those compartments. Before comparing reports, check whether the bone mineral component is included in each number.
Appendicular means the arms and legs. Appendicular lean mass is the combined lean soft tissue in those regions. Research may use the term appendicular skeletal muscle mass for this DEXA-derived estimate, but the scanner does not directly isolate every muscle fibre. Region boundaries and positioning affect the analysis.
Calculate the index
ALMI divides appendicular lean mass in kilograms by height in metres squared. Our invented example uses 17.6 kg and 1.68 m: 17.6 ÷ 1.68² is about 6.24 kg/m², displayed as 6.2. This is separate from the example’s total lean tissue value of 41.0 kg.
If your report uses a different abbreviation, check the definition. Some indices divide by BMI rather than height squared. Values using different denominators cannot be read against the same cut-point. Keep the original units and formula in your tracking notes.
What the research cut-points mean
EWGSOP2 is a European consensus on sarcopenia, primarily concerned with older people. Its approach puts low strength at the centre of assessment; low muscle quantity or quality helps confirm the condition, and physical performance informs severity. A scan number alone does not complete that assessment.
The table below shows the consensus cut-points. They are not athlete reference ranges and were not designed to classify a healthy young adult’s training progress. A 25-year-old with an ALMI of 7.5 is not “nearly sarcopenic” on the basis of that value. Equally, a value above a listed boundary does not prove that strength or function is normal.
What changes lean tissue readings
Fluid balance and stored carbohydrate can influence measured lean tissue. Food, drink, exercise and recent illness can make repeat conditions less comparable. This is why a short-term increase should not automatically be described as kilograms of new muscle.
For training follow-up, record preparation and ask for the clinic’s precision assessment. At an illustrative 2% precision on 50 kg lean tissue, the 95% least significant change calculation is 2.77 kg. That is not a universal scanner limit. Use the clinic’s own measured LSC when available.
Discuss the scan alongside strength, recovery, daily function and the training programme. Nutrition and resistance exercise are topics a practitioner may discuss, but the report alone cannot prescribe protein intake, loading or a rescan date. Choose a repeat test only when the result is likely to influence a decision.
Questions for your practitioner
- Does this lean value include bone mineral?
- Which ALMI definition and reference have been used?
- How do strength and function compare with the scan findings?
Sources checked 23 September 2026: Source 1 · Source 2 · Source 3.
Open the full lean mass and almi on your report guide ↗Visceral fat: scanner, units and reference
DEXA estimates visceral adipose tissue, often shortened to VAT. Identify the scanner and units first: kilograms, grams, volume and area are different measurements.
| Age | Men: mass / volume | Women: mass / volume |
|---|---|---|
| 18-19 | 0.18 kg / 186 cm³ | 0.04 kg / 45 cm³ |
| 20-24 | 0.25 kg / 261 cm³ | 0.06 kg / 60 cm³ |
| 25-49 | 0.71 kg / 746 cm³ | 0.55 kg / 579 cm³ |
| 50+ | 1.62 kg / 1,708 cm³ | 1.21 kg / 1,285 cm³ |
Read the label before the colour
Visceral fat is fat inside the abdominal cavity. It is different from all abdominal fat and from the android region used in body composition analysis. A report can contain both an android measurement and a VAT estimate without those labels referring to the same compartment.
GE CoreScan reports can give VAT mass and volume. Hologic software can report VAT area and mass. Software version and analysed region matter as well as the manufacturer name. Do not transfer a number from one unit to a threshold in another unit.
What a population median tells you
The GE table summarises medians reported in a US iDXA cohort of 649 adults. A median is the middle of the reference distribution, not a recommended upper limit. The broad 25 to 49 age group also contains people at many different stages of life.
Our invented example has VAT of 0.62 kg and 655 cm³. Those are slightly above the reported female median of 0.55 kg and approximately 579 cm³ for ages 25 to 49 in that cohort. That observation does not label the example healthy or unhealthy, and it cannot determine a treatment need.
A report’s coloured categories may come from a manufacturer-specific interpretation system. We have not independently verified the requested Hologic manual thresholds for the exact software version, so they are not reproduced here as advice. Ask your clinic for its current manual and reference.
Accuracy is not interchangeability
Validation research compares DEXA estimates with another imaging method such as CT. Agreement at a group level does not mean every individual estimate is exact, or that two manufacturers’ values can be swapped. Later cross-system research specifically examines these differences.
When tracking, use the same scanner and analysis protocol where possible. Ask whether a software change or region adjustment affects comparability. Keep the complete report rather than recording only a colour label or one rounded number.
What to do with a concerning result
Discuss your visceral fat result with your GP. The useful question is how it fits your history and other relevant findings, not simply whether it is above a cohort median. Your GP may consider measurements and tests beyond the scan. The DEXA report is one piece of that conversation.
A dietitian or other treating practitioner can help translate agreed goals into practical steps. A generic target number or guaranteed timeline would miss differences in health, medication, training and circumstances. If repeating the test, agree what decision the new result would inform and ask about VAT-specific repeatability.
Do not calculate a personal risk percentage from the table. The table describes the published population; it does not measure your chance of a future event. A change smaller than the clinic’s reliable measurement threshold may also be difficult to distinguish from ordinary variation.
Questions for your practitioner
- Is my VAT shown as area, mass or volume?
- Which manufacturer reference explains the colour band?
- How does this fit my health history, and would a repeat scan change care?
Sources checked 23 September 2026: Source 1 · Source 2 · Source 3 · Source 4.
Open the full visceral fat: scanner, units and reference guide ↗Regional fat: android, gynoid and left/right
Regional analysis describes where measurements were taken. Ratios compare selected regions, but the definitions and region boundaries need to match before you compare reports.
Android/gynoid fat ratio references
The source uses a reversed fitness-style ranking: 90th means the lower end of the distribution, 10th the higher end. These labels do not measure fitness or health.
| Age | n | Mean ± SD | 90th | 80th | 70th | 60th | 50th | 40th | 30th | 20th | 10th |
|---|---|---|---|---|---|---|---|---|---|---|---|
| 20-29 | 562 | 0.33± 0.11 | 0.20 | 0.24 | 0.26 | 0.28 | 0.31 | 0.34 | 0.36 | 0.40 | 0.47 |
| 30-39 | 196 | 0.39±0.17 | 0.20 | 0.24 | 0.29 | 0.33 | 0.37 | 0.40 | 0.43 | 0.49 | 0.62 |
| 40-49 | 258 | 0.44±0.17 | 0.24 | 0.29 | 0.34 | 0.38 | 0.41 | 0.46 | 0.50 | 0.56 | 0.63 |
| 50-59 | 437 | 0.48±0.18 | 0.28 | 0.35 | 0.39 | 0.43 | 0.46 | 0.51 | 0.55 | 0.60 | 0.69 |
| 60-69 | 440 | 0.50±0.15 | 0.32 | 0.38 | 0.42 | 0.45 | 0.48 | 0.52 | 0.57 | 0.62 | 0.72 |
| 70-79 | 183 | 0.46±0.13 | 0.31 | 0.36 | 0.40 | 0.44 | 0.47 | 0.50 | 0.54 | 0.59 | 0.66 |
Choose an age to highlight a row. No values are sent to the server.
Population reference, not a target. 3,327 US adults, 95% Caucasian; GE Lunar Prodigy or iDXA. These are not Australian norms or athlete targets. Source and table ↗ · Checked 23 September 2026.
Trunk/limb fat ratio references
The source uses a reversed fitness-style ranking: 90th means the lower end of the distribution, 10th the higher end. These labels do not measure fitness or health.
| Age | n | Mean ± SD | 90th | 80th | 70th | 60th | 50th | 40th | 30th | 20th | 10th |
|---|---|---|---|---|---|---|---|---|---|---|---|
| 20-29 | 562 | 0.96±0.25 | 0.71 | 0.79 | 0.85 | 0.88 | 0.92 | 0.97 | 1.03 | 1.10 | 1.21 |
| 30-39 | 196 | 1.06±0.34 | 0.72 | 0.80 | 0.86 | 0.92 | 1.01 | 1.06 | 1.15 | 1.23 | 1.48 |
| 40-49 | 258 | 1.12±0.39 | 0.76 | 0.86 | 0.93 | 0.97 | 1.03 | 1.12 | 1.20 | 1.31 | 1.48 |
| 50-59 | 437 | 1.18±0.39 | 0.79 | 0.89 | 0.99 | 1.05 | 1.13 | 1.21 | 1.30 | 1.42 | 1.62 |
| 60-69 | 440 | 1.15±0.29 | 0.82 | 0.92 | 0.98 | 1.04 | 1.12 | 1.19 | 1.28 | 1.36 | 1.55 |
| 70-79 | 183 | 1.12±0.26 | 0.80 | 0.89 | 0.99 | 1.06 | 1.12 | 1.16 | 1.22 | 1.30 | 1.44 |
Choose an age to highlight a row. No values are sent to the server.
Population reference, not a target. 3,327 US adults, 95% Caucasian; GE Lunar Prodigy or iDXA. These are not Australian norms or athlete targets. Source and table ↗ · Checked 23 September 2026.
Android and gynoid are regions
Android refers to an abdominal region; gynoid refers to a region around the hips and upper thighs. The software draws these regions using its analysis rules. An android result is not a direct synonym for visceral fat, because abdominal tissue includes other compartments.
An android-to-gynoid ratio may compare regional fat percentages. Read the report definition before calculating it yourself. Dividing android fat kilograms by gynoid fat kilograms is a different operation if the report expects a ratio of percentages.
Use the matching reference table
Imboden and colleagues published GE-specific percentiles for android/gynoid and trunk/limb ratios. Their sample was predominantly Caucasian US adults scanned on Lunar Prodigy or iDXA. The tables do not establish a universal ratio that everyone should aim below.
The study’s reversed ranking puts lower values towards the higher numbered percentiles. This presentation describes the distribution in that source. It does not turn a regional ratio into a fitness grade, nor does a low ratio necessarily mean that all relevant health measures are favourable.
Trunk/limb and trunk/leg ratios are not interchangeable. A denominator containing all limbs includes the arms as well as the legs. The name, units and formula should be recorded along with the value. The exact region definitions are part of the measurement.
A small asymmetry is not an injury diagnosis
Left and right regions let a practitioner compare corresponding limbs. Compare the same compartment on both sides: left arm lean tissue with right arm lean tissue, for example. Comparing fat on one side with lean tissue on the other creates a meaningless difference.
Our example shows a 0.3 kg lean difference. We do not call this “normal” or “under typical asymmetry”, because a universal threshold is not established by the cited tables. Positioning, analysis boundaries, limb size and the reason for the test all affect what a difference means.
What matters at a repeat appointment
Ask whether the regions were reviewed and drawn consistently. A small change in a boundary can shift tissue from one region into another without changing whole-body composition. This can make a regional result look different while the total remains similar.
If the question concerns injury or function, a clinician also needs symptoms, examination and relevant history. DEXA alone cannot identify why a side differs or prescribe a rehabilitation programme. A repeated asymmetry can be worth discussing without being treated as proof of a problem.
Keep regional comparisons within the same scanner system and protocol when possible. There is no general number of weeks after which a ratio should improve. Agree on the question and the likely size of a useful change before booking another scan.
Questions for your practitioner
- Does this ratio use fat mass or fat percentage?
- Were the region boundaries checked consistently?
- Does the side-to-side difference fit any symptoms or functional findings?
Sources checked 23 September 2026: Source 1 · Source 2.
Open the full regional fat: android, gynoid and left/right guide ↗Bone density and T-scores
Bone mineral density and a T-score help describe bone measurements, but the scan site, protocol and clinical context determine how a result is interpreted. Discuss bone density findings with your GP.
| T-score | Term |
|---|---|
| -1.0 or above | Normal |
| Below -1.0 and above -2.5 | Low bone mass (osteopenia) |
| -2.5 or below | Osteoporosis threshold |
| -2.5 or below plus fragility fracture | Severe osteoporosis (traditional WHO description) |
BMC and BMD answer different questions
Bone mineral content is a measured mineral mass, usually reported in grams. Bone mineral density from DXA is mineral mass relative to projected bone area, usually g/cm². Neither number is the weight of the whole skeleton, and a larger BMC does not automatically mean stronger bones.
Whole-body body composition reports may display BMC, total-body BMD and scores. A diagnostic bone density examination uses a specific protocol and accepted sites. A total-body value should not be substituted for a hip or spine result when interpreting diagnostic thresholds.
Which adults use T-score classification?
A T-score compares BMD with a young-adult reference. ISCD applies the WHO classification in postmenopausal women and men aged 50 or older, using accepted diagnostic sites. The criteria may also be applied during the menopausal transition. That does not make age alone a reason to order a scan.
For hip T-scores, the ISCD position uses a uniform White female reference and NHANES III for femoral neck and total hip. Lumbar spine reference databases are supplied by manufacturers. These conventions explain the calculation; they do not mean the reader belongs to that reference population.
How to read the bands
The WHO Study Group report, Technical Report Series 843, describes normal bone density, low bone mass and osteoporosis categories. A T-score of -1.0 sits in the normal band; values below -1.0 but above -2.5 fall in the low bone mass band; -2.5 or lower reaches the densitometric osteoporosis threshold in the appropriate setting.
A fragility fracture and other clinical factors can change assessment and management. The traditional severe osteoporosis description combines the osteoporosis BMD threshold with fragility fracture. A website cannot establish whether an injury was a fragility fracture or whether a diagnostic criterion applies to your particular examination.
Follow the report into a GP conversation
Discuss the scan site, conclusion and reason for testing with your GP. Your practitioner considers fracture history, medicines and other risk factors as well as BMD. A category is not the whole assessment, and a report without a concerning category does not rule out all fracture risk.
Follow-up testing is chosen when it can answer a clinical question. Comparing BMD across machines requires appropriate cross-calibration, and the facility’s own least significant change matters. Do not apply the body composition lean-mass calculator to a bone density result.
Medicare eligibility and clinical interpretation are separate questions. A qualifying item has a descriptor and interval conditions; a schedule fee is not the same as the clinic’s charge. The Medicare guide explains the current published items so you can check them with the referring doctor and clinic.
Questions for your practitioner
- Was this a diagnostic hip/spine scan or a whole-body composition scan?
- Which score and reference are appropriate for me?
- Would a repeat scan change a clinical decision, and when?
Sources checked 23 September 2026: Source 1 · Source 2 · Source 3.
Open the full bone density and t-scores guide ↗What a bone density Z-score means
A Z-score compares a bone density measurement with an age-matched reference. It is expressed in standard deviations, not a percentage and not a diagnosis.
| Z-score | ISCD wording |
|---|---|
| -2.0 or lower | Below the expected range for age |
| Above -2.0 | Within the expected range for age |
A reference comparison, not a percentage
A Z-score of zero is at the reference mean. A negative number is below that mean and a positive number is above it. A Z-score of -1 does not mean that bone density is one per cent low, or that someone has lost a fixed amount of bone. The scale reflects the reference distribution.
Z-scores and percentiles both describe comparison with a reference, but they are not interchangeable labels. The relationship depends on the distribution and the method used. Copy the score exactly as reported instead of turning it into a percentage without the appropriate reference calculation.
When Z-scores are preferred
ISCD prefers Z-scores rather than T-scores in women before menopause and men younger than 50. The terminology also differs: a Z-score of -2.0 or lower is described as below the expected range for age, while a value above -2.0 is within the expected range for age.
This wording should not be replaced with T-score category names. In particular, osteoporosis cannot be diagnosed in men under 50 using BMD alone. The practitioner needs the clinical setting and other findings. Children require a separate paediatric approach and are outside these adult explanations.
What does a Z-score of -1 mean?
It means the measurement is one standard deviation below the selected age-matched mean. Under the adult terminology above, that number is within the expected range for age. It does not provide an all-clear for every bone-health concern, and it does not diagnose low bone mass using the T-score bands.
If the score was unexpected, ask about the measured site, the reference database and the report’s conclusion. The clinic can check whether age and other relevant demographic inputs were entered correctly. A useful discussion starts with the whole report rather than a single signed number.
Comparisons between visits
An age-matched score can change partly because the reference comparison changes as someone gets older. Keep the absolute BMD value, scan site and scanner details as well as the score. A change in Z-score alone is not a direct measure of kilograms or percentage of bone gained.
The facility’s measurement precision and cross-calibration rules apply to follow-up bone density. Ask whether an observed BMD difference reaches the facility’s least significant change. A different scanner or database may make score comparisons misleading even when the printed numbers look similar.
Discuss bone density findings with your GP, especially when the report flags an unexpected value or you have relevant fracture or health history. The scan is a measurement used in an assessment. The appropriate next step may be clarification of the report, review of other risk factors or further clinical investigation rather than simply repeating the scan.
Questions for your practitioner
- Is Z-score the appropriate comparison for my age and circumstances?
- Which site and age-matched database were used?
- What does the report conclusion mean alongside my history?
Sources checked 23 September 2026: Source 1 · Source 2.
Open the full what a bone density z-score means guide ↗Is a change larger than measurement variation?
At 95% confidence, the usual least significant change calculation is 2.77 times the facility’s precision error. Ask the clinic for its measured LSC. Minimum acceptable precision standards are not a substitute for that clinic-specific assessment.
At the ISCD minimum acceptable precision examples, 2% of 50 kg lean tissue gives 1 kg precision error and an LSC of 2.77 kg. For 18 kg fat mass at 3%, the equivalent LSC is about 1.50 kg. Better precision gives a smaller threshold. These are calculations, not promises about your scanner.
Is the change larger than measurement variation?
Use the same measure, units, scanner and comparable preparation. The 2% starting value is an educational lean-mass example, not your clinic’s measured precision. For fat mass, the ISCD minimum acceptable precision example is 3%. Replace this with the clinic’s own precision or ask for its LSC directly.
Enter positive values to calculate an illustrative threshold.
This approximation converts relative precision using the first value. An exceeded threshold is not proof of muscle gain, fat loss or a clinically important change. Hydration and protocol differences still matter. Values stay in your browser.
Source: ISCD precision assessmentThe original reviewed report-label guide
Fat mass and body fat percentage
Fat mass is a weight, usually in kilograms. Body fat percentage puts that amount in relation to total scanned mass. They answer different questions, so it helps to read them together.
This original teaching example uses 18 kg of fat in a total scanned mass of 72 kg. That is 25%. These are made-up values to explain the calculation, not a suggested goal.
Two percentage columns can mean different things
In the report format pictured in STRIVE’s booklet, tissue % fat compares fat with soft tissue mass, while region % fat compares fat with total regional mass, including bone mineral. Always check your own report’s definitions.
Using this separate teaching example: 18 kg fat + 51 kg lean tissue + 3 kg bone mineral = 72 kg total scanned mass.
Fat as a share of total mass is 18 ÷ 72 × 100 = 25.0%. Fat as a share of soft tissue mass is 18 ÷ 69 × 100 ≈ 26.1%. Neither value is a suggested target.
Check the comparison group. Published body composition references vary with age, sex and population. Kelly and colleagues’ NHANES reference study uses US data. It is a reference distribution, not a personalised health target for everyone in Australia. Ask which database your report uses.
Lean tissue is not all muscle
The lean tissue value includes water and organs as well as muscle. If you are following a training programme, it is tempting to read every increase as muscle growth. The scan alone cannot support that conclusion.
Compare the report with your training record and the conditions before each scan. Your practitioner can help decide whether the change is useful. The AIS explains why body composition is only one part of performance.
BMC, lean tissue and lean + BMC
Bone mineral content (BMC) is the amount of mineral measured in a region, usually given in grams. It is not the weight of the whole bone, and it is different from bone mineral density, which is reported per unit area.
A column labelled lean + BMC combines lean soft tissue with bone mineral content. A column labelled lean mass may exclude BMC. Read the column heading before comparing two reports, especially if they came from different systems.
In this separate teaching example, 51 kg of lean tissue and 3 kg of BMC give 54 kg of lean + BMC. If your report uses grams, 1,000 g equals 1 kg. Discuss bone health findings with your GP.
Android and gynoid regions
Android is an abdominal region. Gynoid is a region around the hips and upper thighs. These labels describe where the scanner’s software has drawn an area for analysis.
When labelled as a fat-percentage ratio, A/G divides android fat percentage by gynoid fat percentage. Check the software’s definition before comparing it with another report. The android region is not the same as visceral fat: an abdominal region also includes fat outside the abdominal cavity.
A ratio below 1 is not presented here as a universal target. Interpretation needs the relevant reference data and your health context. Discuss concerns about abdominal or visceral fat with your GP.
Percentiles, AM and YN
A percentile describes a position within a reference distribution. The 50th percentile is the middle of that distribution. It does not mean that you have 50% body fat or that your health is halfway to a goal.
AM usually means age-matched. YN or YA may identify a young-normal or young-adult comparison. Check the legend: labels and reference groups vary by report. A percentile and a Z-score are different ways of describing a reference comparison, not interchangeable numbers.
A higher percentile is not automatically better. First ask which measurement is being compared, who is in the reference group and whether that comparison is useful for you. The NHANES body composition reference study illustrates why the metric, age, sex and reference population matter.
Appendicular lean mass index
“Appendicular” refers to your arms and legs. ALMI divides their combined lean tissue mass by height squared and is reported in kg/m². Check that your height was recorded correctly.
The index is used in muscle-health assessment, but it does not measure strength. Don’t treat a colour band as a diagnosis. Ask which reference population and clinical criteria were used. See the ISCD body composition positions.
Visceral fat
This is an estimate of fat within the abdominal cavity. Look carefully at the label and units. An area in cm², a volume in cm³ and a weight in grams describe different quantities.
A manufacturer’s coloured scale needs to be read with that system’s documentation. We do not provide a universal cut-off here. Discuss your visceral fat result with your GP, who can put it alongside your health history and other relevant findings. ISCD reporting guidance covers optional body composition measures and their limitations.
Bone mineral density
A body composition report may contain bone measurements, but an osteoporosis assessment uses a dedicated protocol. Check whether your report is for whole-body composition or a diagnostic scan of sites such as the hip and spine.
Discuss bone density results with your GP. Your age, history and reason for testing affect their meaning. Healthdirect’s Australian guide explains diagnostic bone density testing and referrals.
T-scores and Z-scores
A T-score compares bone density with a young-adult reference. A Z-score uses an age-matched reference. They are not percentages.
The ISCD positions apply T-score classification to postmenopausal women and men aged 50 or older. In the appropriate diagnostic setting, a T-score of -2.5 or lower at an accepted site meets the densitometric threshold for osteoporosis. A Z-score of -2.0 or lower is described as below the expected range for age.
Those thresholds do not let this website diagnose you. Discuss the score, scan site and report conclusion with your GP. A whole-body T-score is not interchangeable with a diagnostic hip or spine T-score.
Left and right regions
Read the same measurement on each side. An arm’s fat mass is not comparable with the other arm’s lean tissue mass. Check the region labels before looking at the difference.
If a difference concerns you, ask the practitioner to review positioning and region boundaries. Bring any injury history or symptoms to that conversation. There is no universal “acceptable difference” supplied by this guide.
Sources and how to use them
These links let you check the source material. Reference ranges depend on the population, equipment and reporting method. Clinics in Australia may use different systems.
- ISCD Official Adult Positions, 2023: reporting conventions and diagnostic context.
- Kelly, Wilson and Heymsfield, 2009: body composition references from NHANES.
- Healthdirect: bone density scanning: Australian patient guidance.
- Australian Institute of Sport: DXA best practice: purpose and assessment practice.
STRIVE’s educational booklet
The explanations of report columns, BMC, regional labels and percentiles draw in part on Total Body Composition & Bone Density: Understanding your analysis, supplied by STRIVE Performance Dietetics and credited to Kristof Szanto, Accredited Practising Dietitian (pages 2 to 6 and 10). Adapted with permission.
We have adapted these explanations for this guide and use invented values in our interactive example.
Sources checked 6 September 2026. Read our editorial policy.
Common questions about results
What is a good body fat percentage on a DEXA scan?
There is no single percentage that suits everyone. Published tables describe a reference population, not a target. Check the scanner, age group and sex group, then discuss the result alongside your health, strength, nutrition and reason for testing.
Why is my DEXA percentage different from my smart scale?
DEXA and bioimpedance scales estimate body compartments using different measurements and assumptions. Hydration and preparation can also affect comparisons. Neither an automatic correction factor nor combining both methods into one trend is reliable.
What does ALMI mean?
Appendicular lean mass index is arm and leg lean tissue divided by height in metres squared. It is one measure of muscle quantity. It does not measure strength and cannot diagnose sarcopenia by itself.
Is a Z-score of -1 bad?
ISCD describes adult Z-scores above -2.0 as within the expected range for age. That wording is a reference comparison, not a complete assessment of bone health. Ask your GP about the scan site, report conclusion and your medical history.
How often should I have another scan?
Agree on an interval that answers a useful clinical or training question. The reason for testing, expected change, scanner precision and whether the scan is for bone density or body composition all matter. There is no universal schedule for everyone.
Does lean mass mean muscle mass?
No. Lean soft tissue includes water and organs as well as muscle. Bone mineral content is reported separately. A change in lean tissue can reflect more than a change in muscle.
Can I compare results from GE and Hologic?
Do not treat values from different scanner families as interchangeable. Software, calibration, region definitions and reference databases differ. Ask the clinic whether a meaningful comparison is possible before interpreting a change.
Does a whole-body scan diagnose osteoporosis?
A body composition scan is not a substitute for a diagnostic bone density assessment at appropriate sites. Your GP or specialist interprets bone health findings alongside age, menopause status, fracture history and other relevant information.
How do I know if a change is larger than measurement variation?
Ask the clinic for its least significant change for the measurement. At 95% confidence, the usual calculation is 2.77 times measured precision error. Our calculator is an illustration and cannot replace the clinic’s precision assessment or confirm why a number changed.
BEFORE YOU BOOK
Find the right appointment.
For diagnostic bone density, start with your referring doctor. For body composition, compare what is included and who will explain the report.
Browse prices in all six cities ↗
Search the national scan directory ↗
Only your city choice is remembered in this browser. No location permission or email address is needed.
MEET KRISTOF
Kristof Szanto
Accredited Practising Dietitian · Advanced Sports Dietitian
Kristof is the founder and owner of STRIVE Performance Dietetics in Sydney. He leads a team of sports dietitians at a high-performance nutrition clinic, with a focus on developing Australia’s next generation of world champions.
He specialises in combat sports, weight-making athletes and youth athlete development. His work combines evidence-based nutrition with practical strategies to help athletes fuel their training, recover and prepare for competition.
Across elite sport, education and performance testing, Kristof helps athletes build nutrition habits that support them throughout their careers.
STRIVE Performance Dietetics HQ
19/112 McEvoy St, Alexandria NSW 2015
Phone: 0400 943 360
Email: info@strivedietetics.com.au
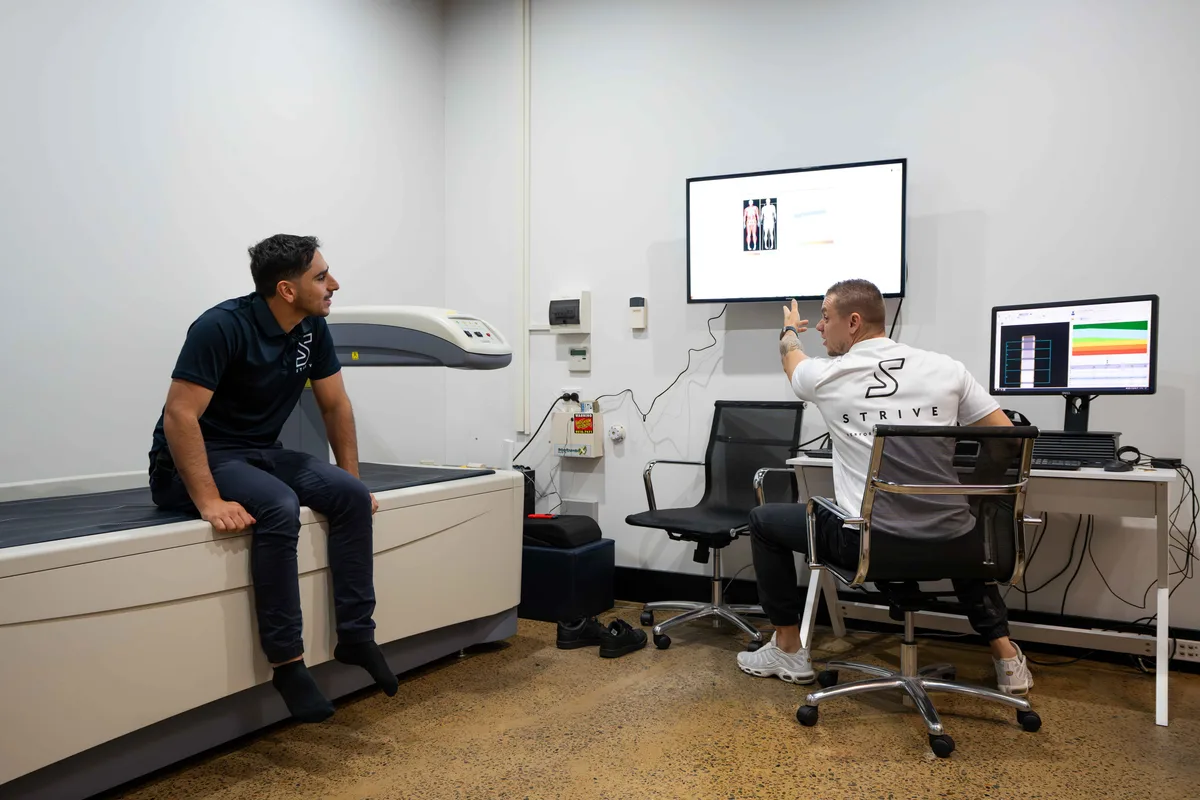
Take your questions to the appointment.
If a label or comparison is unclear, ask the person explaining your scan to point it out on the report. Keep a copy so you can refer to the same measurements next time.
Prepare a few questions ↗